It’s absolutely no secret that real estate is on fire in major areas throughout the Midwest, Southwest, Southeast (basically all those places that have refused draconian – and murderous – lockdown measures). New York, California, Minnesota, Michigan, and other Northern and Democrat controlled States, opted for a ridiculous (and frankly UNSCIENTIFIC response to the flu…) which has lead to thousands of deaths from mental health, substance abuse, and other causes. Regardless of your political stance, these seem to be the final nail in the coffin of these State’s CVB and residential markets – with literally hundreds of thousands of people looking to move out of these States every month.
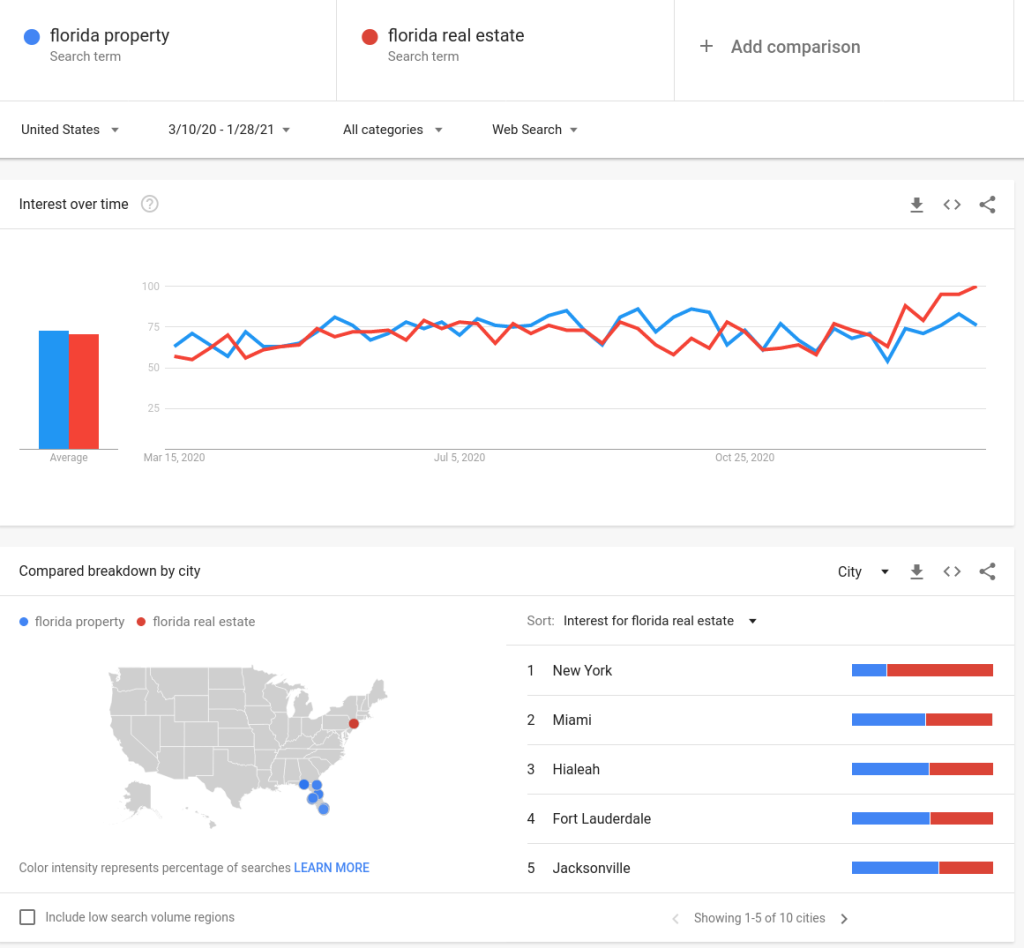
In a report we published just 1 month ago, comparing the search trends for real estate in Florida across the United States, we saw over a 100% increase from March of last year (the beginning of the wuflu) compared to the previous year (and Florida real estate was already BOOMING)! But, the question is, is this sustainable? Well thanks to our partnership and connections with DR Horton, they’ve shared an amazing piece they developed on the differences between this boom and the previous boom, including where we may be heading. Overall it’ll be great news for homeowners, and anyone looking to sell between now and the next couple years. And yes, for now, this time it IS different.
On a local level we’re seeing virtually NO speculation (very few flips, almost no investment property investment) with almost all of the inventory I’m helping clients to buy or sell being exclusively their primary residence. And, unlike previous decades, buyers are selling their main homes in the Northeast – forgoing the luxury of a second retirement home in Southwest Florida – and instead opting for permanent residence in our tropical (and political) paradise.
2003 vs. 2021 – Start of Housing Bubble 2.0? or Beginning of New Normal?
Summary: We find some similarities between 2002-2003 and 2020-2021. We think they are worth discussing and exploring to see whether we find ourselves at the beginning of a potential housing bubble 2.0? or whether this is the beginning of a massive rally that acknowledges the new normal for housing?

Figure 1. Homebuilding Index. Source: Yahoo Finance and HRC.
1998-2001. We begin our analysis looking at the period between 1998-2001. These years were the height of the “dot-com” boom era where anything that had a “.com” attached to its name went public and was instantly worth billions. People chased after them thinking it was the quick way to riches. During this time the builders were seeing fairly steady demand of about 900k new home sales or 1.2 million single family starts and permits. Mortgage rates were fairly stable in a range of 7-8% for a 30-year fixed mortgage. After the dot-coms began to crash, the Fed acted decisively to try to prevent a recession by cutting the Fed funds rate aggressively from 6.5% at the peak in 2000 to 1.0% by Jun-03. This was exacerbated by the 9/11 crisis which put the country at war with terrorism.
2002-2003. With the crash in the stock market, investors moved to the relative safety of owning something tangible like real estate. What could be safer than a home? As interest rates began to go down, we began to see home sales go up. Many homebuyers opted to use variable rate loans rather than fixed rate loans. As the sales pace began to rise, builders began to raise prices hoping to slow down the demand. The more they raised prices, the more that demand went up. Supply began to go down. We saw inventory reach a low of 3-4 months supply in both the new and existing home markets. Orders began to grow rapidly in 2002. The chart below shows that by 3Q02 most builders were seeing very strong order growth activity with several builders posting order growth rates in excess of 50% YOY.

Figure 2. Builder order growth in 2002. Source: Builder press releases and HRC.
The builder stocks reacted by initially going up from their lows of $7.0 billion market cap in Feb-00 (when no one cared about builders and the stock market peaked) to their high of $31.7 billion in Jun-02 after investors started to see the strong order growth. The builders sold off eventually bottoming out at $24.8 billion in Dec-02, down 22% from the high. After reporting the 4Q02 earnings season the stocks were not much higher at $25.6 billion in Feb-03. Although revenue and EPS estimates were going up and the stocks were attractively valued at a P/E of 5.5x and Price/book of 1.36x, many investors felt the stocks had already gone up “too much” and were afraid to get involved in the sector. Some analysts even began to worry of a housing bubble in 2003 and recommended to stay away. Yet the market was just getting started. Anyone who listened to that advice missed out on some nice gains over the next two years.
At the end of 2002, the average price of a new home sold by the public builders was $252,000. Assuming a 5.5% 30-year mortgage rate the payment would be $1,431/mo. Based on a median household income of $45,000 this would represent 38.2% of the gross income. When we compare this vs. today even though the average price of a new home is $402,000, up 60%, we find that the 30-year mortgage rate is now 2.75%, down 50% YOY. This means that the average monthly payment is only up 15% vs. two decades ago. Then we find that median household incomes are up 42% YOY. Therefore, the home payment represents only 30.8% of a buyer’s gross income vs. 38.2% back in 2002 before the bubble started.

Figure 3. Homes are much more affordable today than in 2002.
Then something changed in investor’s view of the sector. And the stocks began to move up sharply. It seems as if the fear was replaced by greed or simply an acknowledgement that the stocks were too cheap and that the stocks deserved a higher valuation given that earnings were rising rapidly. From Mar-03 when the stocks were valued at $26.1 billion to the end of 2003 the builder stocks doubled in price. By Nov-03 they had a market cap of $53.2 billion. This was the beginning the housing bubble.
2004-2005. The builders kept raising prices, and the more they raised, the more they sold, and the higher their margins expanded and earnings went up. What few failed to realize or they simply turned a blind eye was that a large number of the buyers were not end users. Many were simply investors and speculators who realized that buying a new home was the easiest way to make money fast. A buyer only needed to put down a small deposit to get the home started and by the time they closed on the home 6 months later the home had appreciated significantly. They could just close and flip the home for a huge profit. The biggest appreciation happened from Jan-04 to Jul-04 when homes in Las Vegas went up from $300,000 to $600,000 or 100% in just 6 months! Builders were generating gross margins of 50%! The other people who started to buy were subprime buyers who had low FICO scores and no money for a down payment. So builders started to ramp up land buying. They spec built entire communities. We toured some of these “ghost towns” in 2006 where we found 250+ completed specs. Many thought at that time that the sustainable demand was 2+ million new home starts per year. The more homes they sold the more land the builders bought at ever higher prices. Everything was too good to be true. Eventually the music stopped.
Stocks Peak 2.5 years after Bull Run Starts. The market eventually peaked in 2005. The stocks peaked at a market cap of $101 billion in Jul-05. Total housing permits peaked at 2.24 million in Sep-05. Single family starts peaked at 1.84 million in Nov-05. New home sales peaked at 1.40 million in Oct-05. The stocks went up 4x from the beginning of the rally in Mar-03 to the peak in Jul-05.

Figure 4. Single Family permits vs. New Home Sales. Source: US Census and HRC.
What Went Wrong? As we look back in hindsight we find a few things that went wrong.
- Builders were selling homes to non end users. We believe if builders had not been selling homes to investors perhaps things might have not gone up as high as they did and we might not haveD. o you have any video of that? I’d l had the kind of crash we had from 2006-2011.
- Builders were selling homes to unqualified buyers. We now know that many of the buyers should not have been allowed to qualify to buy a home, but the main goal of the Bush administration was to increase the homeownership rate. This is why allowed down payment assistance programs that enabled people to buy with 0% down.
- Lending standards were loose. Many lenders were careless about who they lent to. There were a lot of shenanigans back then that did not become apparent until after the crash. It frankly didn’t matter to those in the mortgage industry at the time because all those mortgages were resold and packed as mortgage backed securities. And these in turn were resold as CDO’s which then became CDO-squared. The goal was simply to originate as many mortgages as possible. At the peak of the cycle there were even Negative Amortization loans, where the principal balance grows. Mortgage lenders allowed investors to buy multiple properties. Everyone turned a blind eye to the speculation and greed that was going on. People simply collected their commission for originating and passed the hot potato along to someone else.
- Buyers raised prices without thinking of the long-term consequences. Instead of focusing on managing the demand by increasing the production capacity and thus mainly the volume but not the price, builders who were up against their production capacity focused on raising the price first. They saw that the more they did that the more their margins went up. However, the long-term consequence was that the land prices went up significantly too. Eventually all the high cost land that was purchased at the peak of the cycle was impaired costing the builders and their investors $27 billion in losses and decimated book values. The end result was home prices crashed leading to over 10 million foreclosures and short sales. In some markets prices went down about 50%-75% from the peak to the trough. There was no land development for over a decade which is why we now have a massive shortage in affordable homes.
The excesses of the housing bubble resulted in the housing crash and the distorted housing market we have experienced over the last 2 decades. This is why so many builders had until the last 2-3 years avoided building affordable homes for entry level buyers and had instead opted to build homes primarily for move-up buyers. This is why we were only building 400k-600k homes over the recovery that lasted from 2011-2018. The Dodd-Frank regulations that came out as a result of this fiasco have helped to some degree avoid some of the excesses this time around, but also made it more difficult for many people to buy a home.
Now we turn to comparing this cycle vs. what happened back then.
Our modern bubble. We would argue that our modern bubble today is crypto currencies. Many retail investors are currently chasing after any new “coin” that shows up thinking that they will be in early on the next bitcoin. This is why we now have 7,000 cryptos vs. 2,000 a year ago. It seems to us few might survive and many will cost investors dearly. That said, watching the Fed print Trillions and watching the government run Trillion dollar deficits does not give us much comfort either in the value of the $US dollar. It is said that 40% of all the money the US has ever printed was printed in 2020 alone.
2020-2021. The stock market and the housing market were doing well at the beginning of 2020 until mid Feb-20. Almost no one seemed to take notice of a virus known as SARS-COV-2 which started spreading from Wuhan China in late 2019 to other parts of the world like South Korea, Italy and Iran in early 2020. After it reached the US in Jan-20 no one paid attention. By mid Feb-20 a few began to ask questions and stocks started to sell-off. By mid Mar-20 the entire world went into panic mode as the crisis was officially named a pandemic. The stock market crashed. The S&P500 fell 34%. Builder stocks fell on average 58%. The Fed acted decisively to try to prevent a recession by cutting the Fed funds rate aggressively from 2.5% where they peaked in Dec-18 to 0.0% by Mar-20.

Figure 5. Change in builder stock prices at onset of COVID crisis. Source: Yahoo finance and HRC.
At first the builder stocks crashed as people were told to stay home and few people bought homes. But fortunately this didn’t last long. By May-20 builders began to see signs of life again which turned into booming demand for housing from Jun-20 to Dec-20. This has now continued into the first few weeks of 2021. Builders have been posting very strong orders in 3Q20 and 4Q20. Yet the stocks have not gone up much on their reports. In fact when we look at the builder stocks they initially peaked at a market cap of $118 billion on October 15, 2020. Then the stocks started to sell off due to analyst concerns that what we were seeing was unsustainable. Nearly 3 months later the stocks were trading at $100 billion on January 8, 2021, down 15%. The stocks barely got back to a value of $117 billion last Thursday February 4, 2021. Despite good 4Q20 results, it seems many investors are afraid to get involved, concerned that the order results won’t last and that we are in the last innings of the last cycle. Many never seemed to realize the housing cycle ended in 2018. Others perhaps fear that we could be seeing the beginning of another bubble. Whatever the case may be the current valuations indicate there is massive fear and disbelief.

Figure 6. Builder order growth in 2020. Source: Builder press releases and HRC.
This morning we received a report that showed home prices in Austin TX have gone up significantly over the last year. When we see this type of data it makes us wonder if we are starting to see the beginning of “Housing Bubble 2.0”.

Figure 7. Resale home sold and prices in Austin TX. Source: Austin realtor.
Yet we don’t see this type of appreciation in the builder homes – at least not yet. If we look at the table below, it shows the average home prices for orders in 4Q20 vs. 1 year ago and 2 years ago. We also see the average 30-year mortgage rate over these periods and the corresponding average home payments below that. Here we can see that in general builders have done a good job of keeping their homes affordable and have not raised prices anywhere near as much as existing home prices have gone up or as much as they could have given the circumstances. We think this reflects the change in product transformation towards affordable homes as well as a conscious effort to focus on maximizing pace, not price, this time around to maintain affordability high and to leverage their fixed costs – interest and SG&A which maximizes earnings and returns.

Figure 8. Average order prices and average mortgage payments over the last 3 years. Source: Builder press releases and HRC.
Valuations are attractive. The builder stocks are trading at some of the lowest P/E’s that we have ever seen in the 20 years we have covered this sector. On a P/E basis using our 2021 EPS estimates we believe the builders are trading at 7.2x. Small caps are trading at 3-4x. Similarly back in Feb-03, the builders were trading at a very low P/E of 5.6x. Having lived through the housing bubble and crash it seems understandable why many investors may be apprehensive to get involved here. Especially if they believe that we are in the 11th inning of the cycle that began in 2011. That cycle was focused on move-up homes and high quality buyers as builders were hoping to avoid getting involved in the entry level sector which led to the chaos last time around.
Yet we think there are many differences worth noting. We are not saying that this could not eventually turn into a bubble. But even if it does, it would seem to us perhaps that is still 2-3 years out into the future and we think the stocks could potentially go up significantly from here before they ultimately peak.
What is different this time? The most dangerous phrase in investing is “It’s different this time”. Yet we believe that there are several the key differences this time around that could allow this boom to be more sustainable and not necessarily turn into a housing bubble.
- The buyers appear to be end users. It seems to us that the majority of the buyers this time around are end users. The bulk seem to be either millennials buying their first home or baby boomers downsizing to a smaller home. Investors who want to buy a new home have to put down a substantial down payment and many builders discourage sales to investors.
- Mortgage lending is still sane. As far as we can tell most mortgage lending is still pretty sane. Buyers have to have a job to qualify for a mortgage and need to come up with a down payment – 3.5% for an FHA loan and 5% for a conventional loan. The only 0% down programs are VA and USDA, but these are not the bulk of sales. Investors need to put down at least 20-30% to buy an investment property. Most buyers need to have a FICO score of 680+. Most builders still say their average FICO is in the low 700’s. While none of this guarantees that buyers won’t eventually default or that home prices can’t go down, at least it seems to remove the main reason why we had the housing bubble in the first place. As long as the mortgage market remains disciplined and does not go back to its old ways this should help to keep the housing market in check to some degree.
- Builders have strong balance sheets. Most builders today have a much better balance sheet than at any time in their history. They have lower leverage and lower cost of debt. The debt maturities are staggered and for most are far out into the future avoiding near-term liquidity issues. This should help them weather any slowdown we eventually face much better.
- Builders have more experience and better business models. Twenty years ago builders were still growing to grow. They were expanding into new markets. They had never seen a housing bubble before. Many were caught up buying land and paying high prices for that land at the peak of the cycle. We believe this time around having the benefit of having lived through the housing bubble they are now better prepared to know what to look out for. They are being more cautious in the way they structure land deals and the assumptions that they make. They realize they have to buy land to replace the communities that are selling out, but they also understand that they have to watch what they pay for it and that they should not build in price increase assumptions. Builders are increasingly using land options to control land. This enables them to walk away in case the market changes or renegotiate their takedowns and what they are paying for finished lots. This should help minimize the level of impairments down the road should the market slow down sharply. Many are now focused on building more affordable homes and have more scale than at any point in time before. They realize that while it is nice to increase prices, they can achieve a better ROIC on their investment by maximizing the sales pace, not the price.
- Price increases for new less than used. While we recognize that low supply and strong demand leads to high home prices, so far it does not appear to us that builders are raising prices to the same degree that we are seeing existing home prices go up. Most builders realize that keeping their prices affordable is the key to maintaining a high sales pace. Most builders are still replacing higher priced communities with lower priced communities. We are still seeing them introduce lower priced affordable communities. Thus we feel that they are not (yet) falling into the trap of raising prices every week. Perhaps that will change soon, but we are closely monitoring this. We believe that raising prices as a way to try to slow down the sales pace and boost margins is a dangerous exercise. We have seen this many times in the past and it never ends well. We believe most builders are being more careful this time around not to repeat the mistakes of the past. But we also recognize that competitive pressures exist and that when there is limited supply the answer often times seems to be to simply raise the price.
2003 vs. 2021. Until CCS reported last week, most builder stocks were not reacting positively to strong 4Q20 results. Then CCS went up 20% last Friday on their good news. This took the builders to a new high of $121 billion. Yesterday we saw most builders follow suit after rising last week closing at another new high of $125 billion. Perhaps investors are finally starting to realize that the results the builders are reporting are not some type of “peak” but perhaps are indeed sustainable. Perhaps they are starting to see that the stocks are very cheap on either Price/book or P/E compared to the returns they are generating and compared to our EPS estimates for 2021 and 2022. It feels to us as if we are at the beginning of what could be a very powerful rally that could take the builder stocks to new highs similar to what happened in 2003 after the 4Q02 earnings season ended. We think it is very possible that we could see builders go up 50%-100% between now and year end. And then possibly go higher from there next year. We believe the housing market will remain strong at the very least through 2023 and possibly until 2028 based on rising demographics of millennials and baby boomers. We say 2023 because that is when the Fed has signaled they plan to keep interest rates low. The only unknown is what will happen to home prices between now and then. It seems they will only keep going up which will prompt buyers to buy now and not wait because the longer they wait the more they will have to pay later.
Conclusion: We are optimistic about the future of the housing market. We believe we are in the 3rd inning of a new cycle that began in 2019 focused on affordability. We believe builders can sustainably build between 900k-1 million new homes per year for the remainder of this decade. We just hope that builders will stay focused on affordability and not go back to simply repeating the mistakes of the past. We are optimistic that perhaps this time it could be somewhat different and hopefully this is not the beginning of a Housing Bubble 2.0, but the beginning of an awakening on the part of investors where they give more credit to the fact that the housing market is strong and that the builders have learned from their mistakes from the past and are eager to not repeat them. We believe the volumes we are seeing are sustainable based on demographics. We believe the margins are likely to go up this year a bit, but we are not necessarily assuming that will continue indefinitely. Eventually, they will go back down a little based on what happens to land costs. But even if that is the case, the operating margins should continue to improve as the builders become bigger and more efficient. Thus we think the earnings are sustainable for a few years. And we think investors should value the builders based on that. Thus we continue to recommend investors buy the builders.
Figure 9. Homebuilding Index still seems to have much upside left over the next few years. Source: Yahoo Finance and HRC.